
Manassas unemployment rose to 3.2% in September from 2.7% a year earlier, and 624 fewer residents held jobs. The city still sits below Virginia and its neighbors.
The unemployment rate in Manassas rose to 3.2% in September. That is up from 2.7% in September 2025 and from 3.1% in August.
The figures come from the U.S. Bureau of Labor Statistics Local Area Unemployment Statistics for the city of Manassas. The September number is preliminary and can be revised next month.
The rise is small, and the city’s rate is still the lowest in its corner of Prince William County. But the count of working residents fell over the year, and the labor force shrank with it.
The numbers for Manassas
| September 2025 | September 2026 | Change | |
|---|---|---|---|
| Unemployment rate | 2.7% | 3.2% | up 0.5 points |
| Residents unemployed | 650 | 748 | up 98 |
| Residents employed | 23,189 | 22,565 | down 624 |
| Labor force | 23,839 | 23,313 | down 526 |
Source: BLS series for Manassas city’s unemployed, employed and labor force.
The figures count where people live, not where they work. A Manassas resident who commutes to a job in Fairfax County or Washington counts here.
Most of the change is in the number of people working. The city had 624 fewer employed residents than a year earlier, but only 98 more counted as unemployed. The rest left the labor force, which counts only people working or looking for work. The BLS data does not say why: people retire, move away or stop looking.
A year of small swings
The rate is not seasonally adjusted, so it moves with the calendar. Over the past year it stayed between 2.7% and 3.5%:
- a low of 2.7% in September 2025
- a high of 3.5% in February 2026
- 2.9% in April, the low point of 2026 so far
- 3.1% in July and August, then 3.2% in September
Because of those seasonal swings, the fairest comparison is the same month a year earlier. On that measure, September was 0.5 points worse.
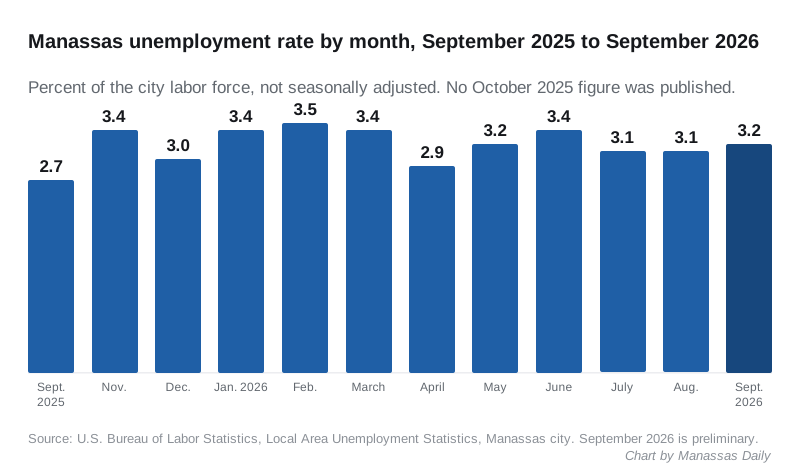
There is no October 2025 figure. The BLS marks that month “data unavailable due to the 2025 lapse in appropriations,” the federal government shutdown.
How Manassas compares
The rate rose over the year in Manassas, Manassas Park (about three miles east), Prince William County and Virginia as a whole. Manassas stayed the lowest of the four:
| Area | September 2025 | September 2026 |
|---|---|---|
| Manassas | 2.7% | 3.2% |
| Manassas Park | 3.1% | 3.4% |
| Prince William County | 3.3% | 3.5% |
| Virginia | 3.4% | 3.6% |
All four figures are not seasonally adjusted, so they compare like with like. Sources: the BLS series for Manassas Park, Prince William County and Virginia. Manassas and Manassas Park are independent cities, so the BLS counts them separately from the county.
The jump in Manassas, 0.5 points, was bigger than the rise in the county or the state, each 0.2 points.
What it means for you
- If you are looking for work, Virginia Career Works Northern runs free career centers across Northern Virginia, with job search help and training referrals. Its site lists free GED preparation for city of Manassas residents.
- If you lost a job, apply for unemployment benefits through the Virginia Employment Commission.
- If you are hiring, about 750 city residents were out of work and looking in September.
- For the wider picture, see our pages on home prices and new businesses in Manassas.
The September numbers are preliminary. We will update this page if the BLS revises them.
Have your say